Below are some screen shots of the finished app!
Splash screen


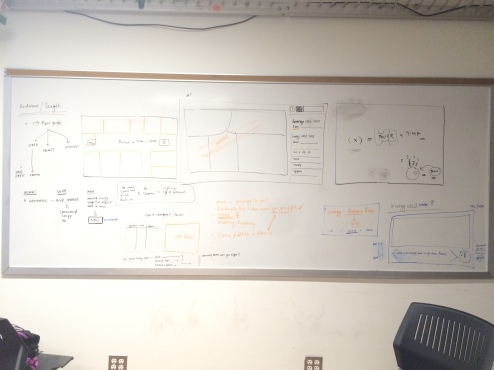
After we decided on the model and the data that is required, it was time to set up the enertiv server and wireframes.
Wireframes by Viniyata
The server is up on itpenertivserver.herokuapp.com
Code is available here – github.com/MathuraMG/enertivServer
After a lot of back end scrubbing and work, I have set up a server for my app to communicate with at itpenertivserver.herokuapp.com
The code for the same is up on github – https://github.com/MathuraMG/enertivServer
Below are a few screen shots of the app right now! (Being developed on phonegap)
After relentless efforts of trying to create heat out of kinetic energy ( will update blog on methods tried), Viniyata and myself found some impracticalities in this idea. But at the same time, we had individually started working on behavior change through the EnertivAPI. (My phone app)
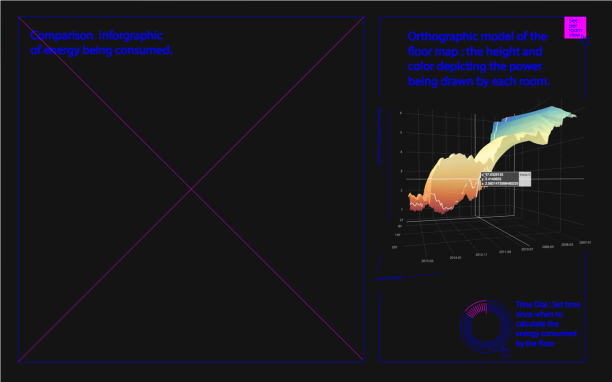
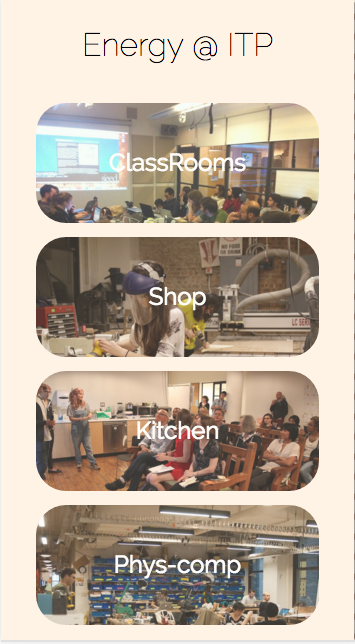
So, we decided to start working on a new project – an interactive heatmap of the ITP floor that lets people know how much energy they are using on this floor and make them understand it in a more meaningful context.
And then began the ideation.
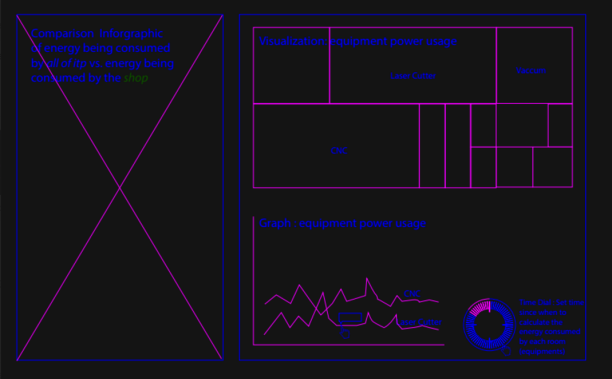
A recent finding/obsession of mine has been enertiv. Enertiv is an energy monitoring system which has been installed on the mystical ITP floor. Not only do they monitor the energy, they also provide APIs to view it. Using that I tried to make a visualization of the energy usage in the Shop over a week ( March 3rd 23:00 – March 10 23:00 EST ) .
The below interactive graph shows the individual usage of each equipment in the shop. The Grey rectangle indicate the hours when the shop is closed. (11pm – 9am)
